The VisCOMET Analysis System provides hardware and software support for the single cell gel electrophoresis (SCGE), commonly called Comet Assay. This easy and rapid method is able to analyse DNA strand breaks within individual cells by direct visualisation using fluorescence microscopy. The Comet Assay is frequently applied for toxicology, oncology, radiation biology and human biomonitoring.
At a Glance
- Easy to use – frequently used operations can be accessed through toolbars.
- Only one click per cell analysis.
- Interactive and automatic measurement modes allow rapid analysis of any cell type.
- Live as well as images from disk can be analyzed.
- Support of various digital and analog cameras as well as framegrabbers.
- Works with 8-16 bit grayscale images as well as color images.
- Various acquisition modes (Accumulation, shading correction, dark field subtraction, etc.); all is done by software, no special and expensive hardware required.
- More than 35 parameters can be calculated.
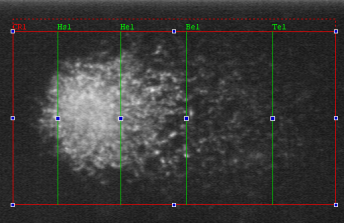
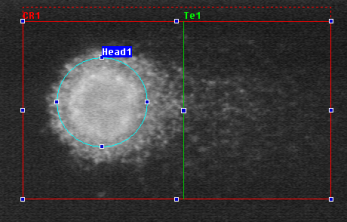
- The comet can be divided into two (head, tail) and three (head, body, tail) parts.
- New sensitive parameters developed together with Dr. N.P. Singh from the University of Washington.
- Multiple comets can be analyzed in one image.
- Comet data are stored as simple ASCII files – easy data exchange with other programs (i.e. Microsoft Excel).
- Built in statistic functions (minimum, maximum, mean, standard deviation, median).
- Single monitor solution (no second video monitor required).
- Low price.
VisCOMET is a data analysing program especially developed for the Comet Assay running under the Windows operating system. It offers the opportunity to study live images directly from the microscope using any video camera with frame grabber or to import digital images (TIFF, BMP) from other sources. All acquired images are automatically stored in an experiment file (ECF) and the data can be exported in a text file (TXT) for further statistical analysis. The program is able to enhance signals during image acquisition by integrating multiple frames or by using a shading correction. Additionally the software can handle monochrome images (8-16 bit per sample) and color images (3×8 bit per sample).
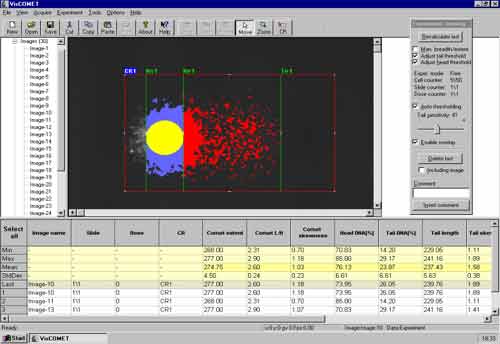
VisCOMET enables you to operate from convenient toolbars, making analysis simple and fast, one click per cell. Comets are identified interactively within the comet image visualised by a coloured overlay. Even comet fragments in the tail which are separated from the head can be analysed. Segmentation of the comet can be performed optional into three sections (by Singh) and up to 31 parameters can be calculated automatically. During experiment group statistics (maximum, minimum, mean and standard deviation) can be observed interactively with acquisition of each cell.
VisCOMET is organised in three different working windows, which can be resized. The workspace window represents the content of an experiment (images, data, properties). The image window displays the images from a snapshot or the live images. The segmentation of head and tail is visualised by a coloured overlay. The data window shows a data sheet with all numeric values and features, which were selected. The actual mean of the comet parameters and the last measured values are marked in different colours.
From the experiment menu deletion of the last measurement is possible. Boundary lines for head and tail region can be replaced manually and parameters can be recalculated. Additionally the tail sensitivity can be controlled directly from the experiment menu. Comments can be included in the table for each cell analyzed in an image.


